Cylenivo: a tool, not a cockpit

Most flow tools act as if their real customer is the manager. Dashboard, traffic light, heatmap, reporting done. In that story, the team shows up only as a data supplier.
That's one of the reasons I built Cylenivo (another is that Jira simply doesn't have any good or meaningful reporting).
What it's about
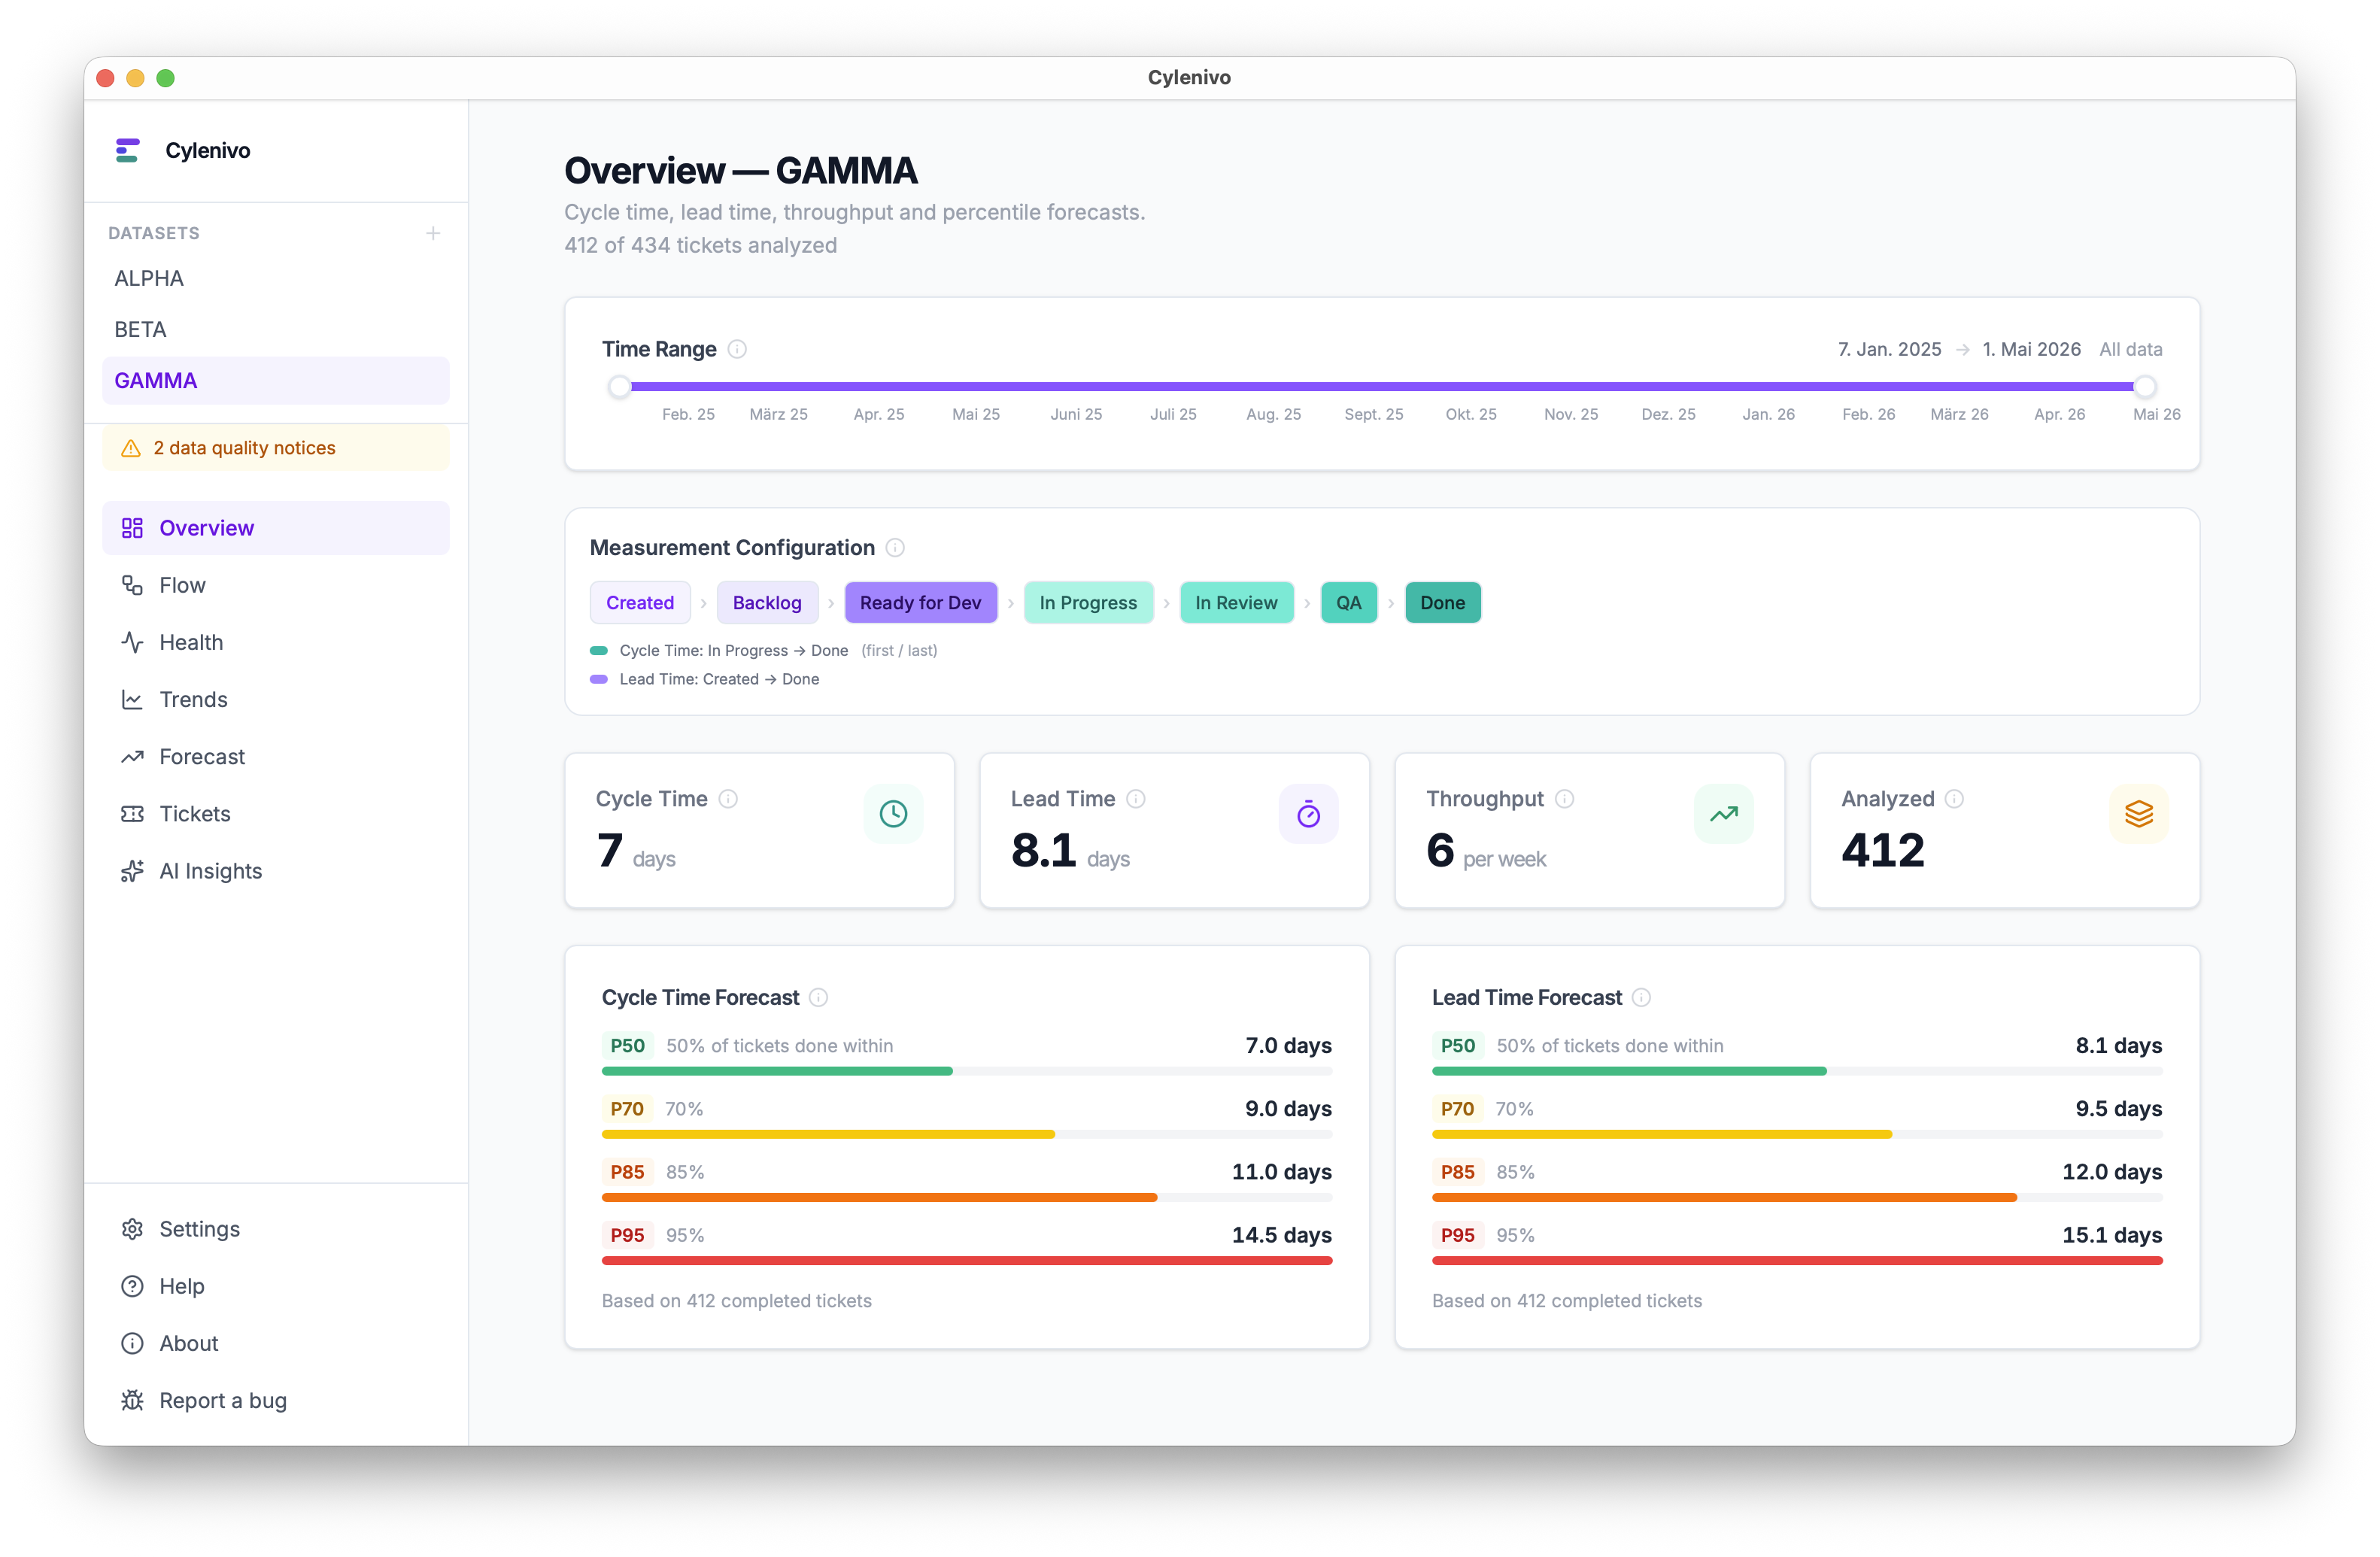
Cylenivo is a small, free desktop app (Windows, Mac and Linux) that computes Cycle Time, Lead Time, Throughput, Time in Status and Rework from your ticket data. It pulls the data from Jira, or via plugins from Trello or OpenProject, and processes it locally.
That's the whole trick: an insight tool, not a surveillance tool.
Why I built it
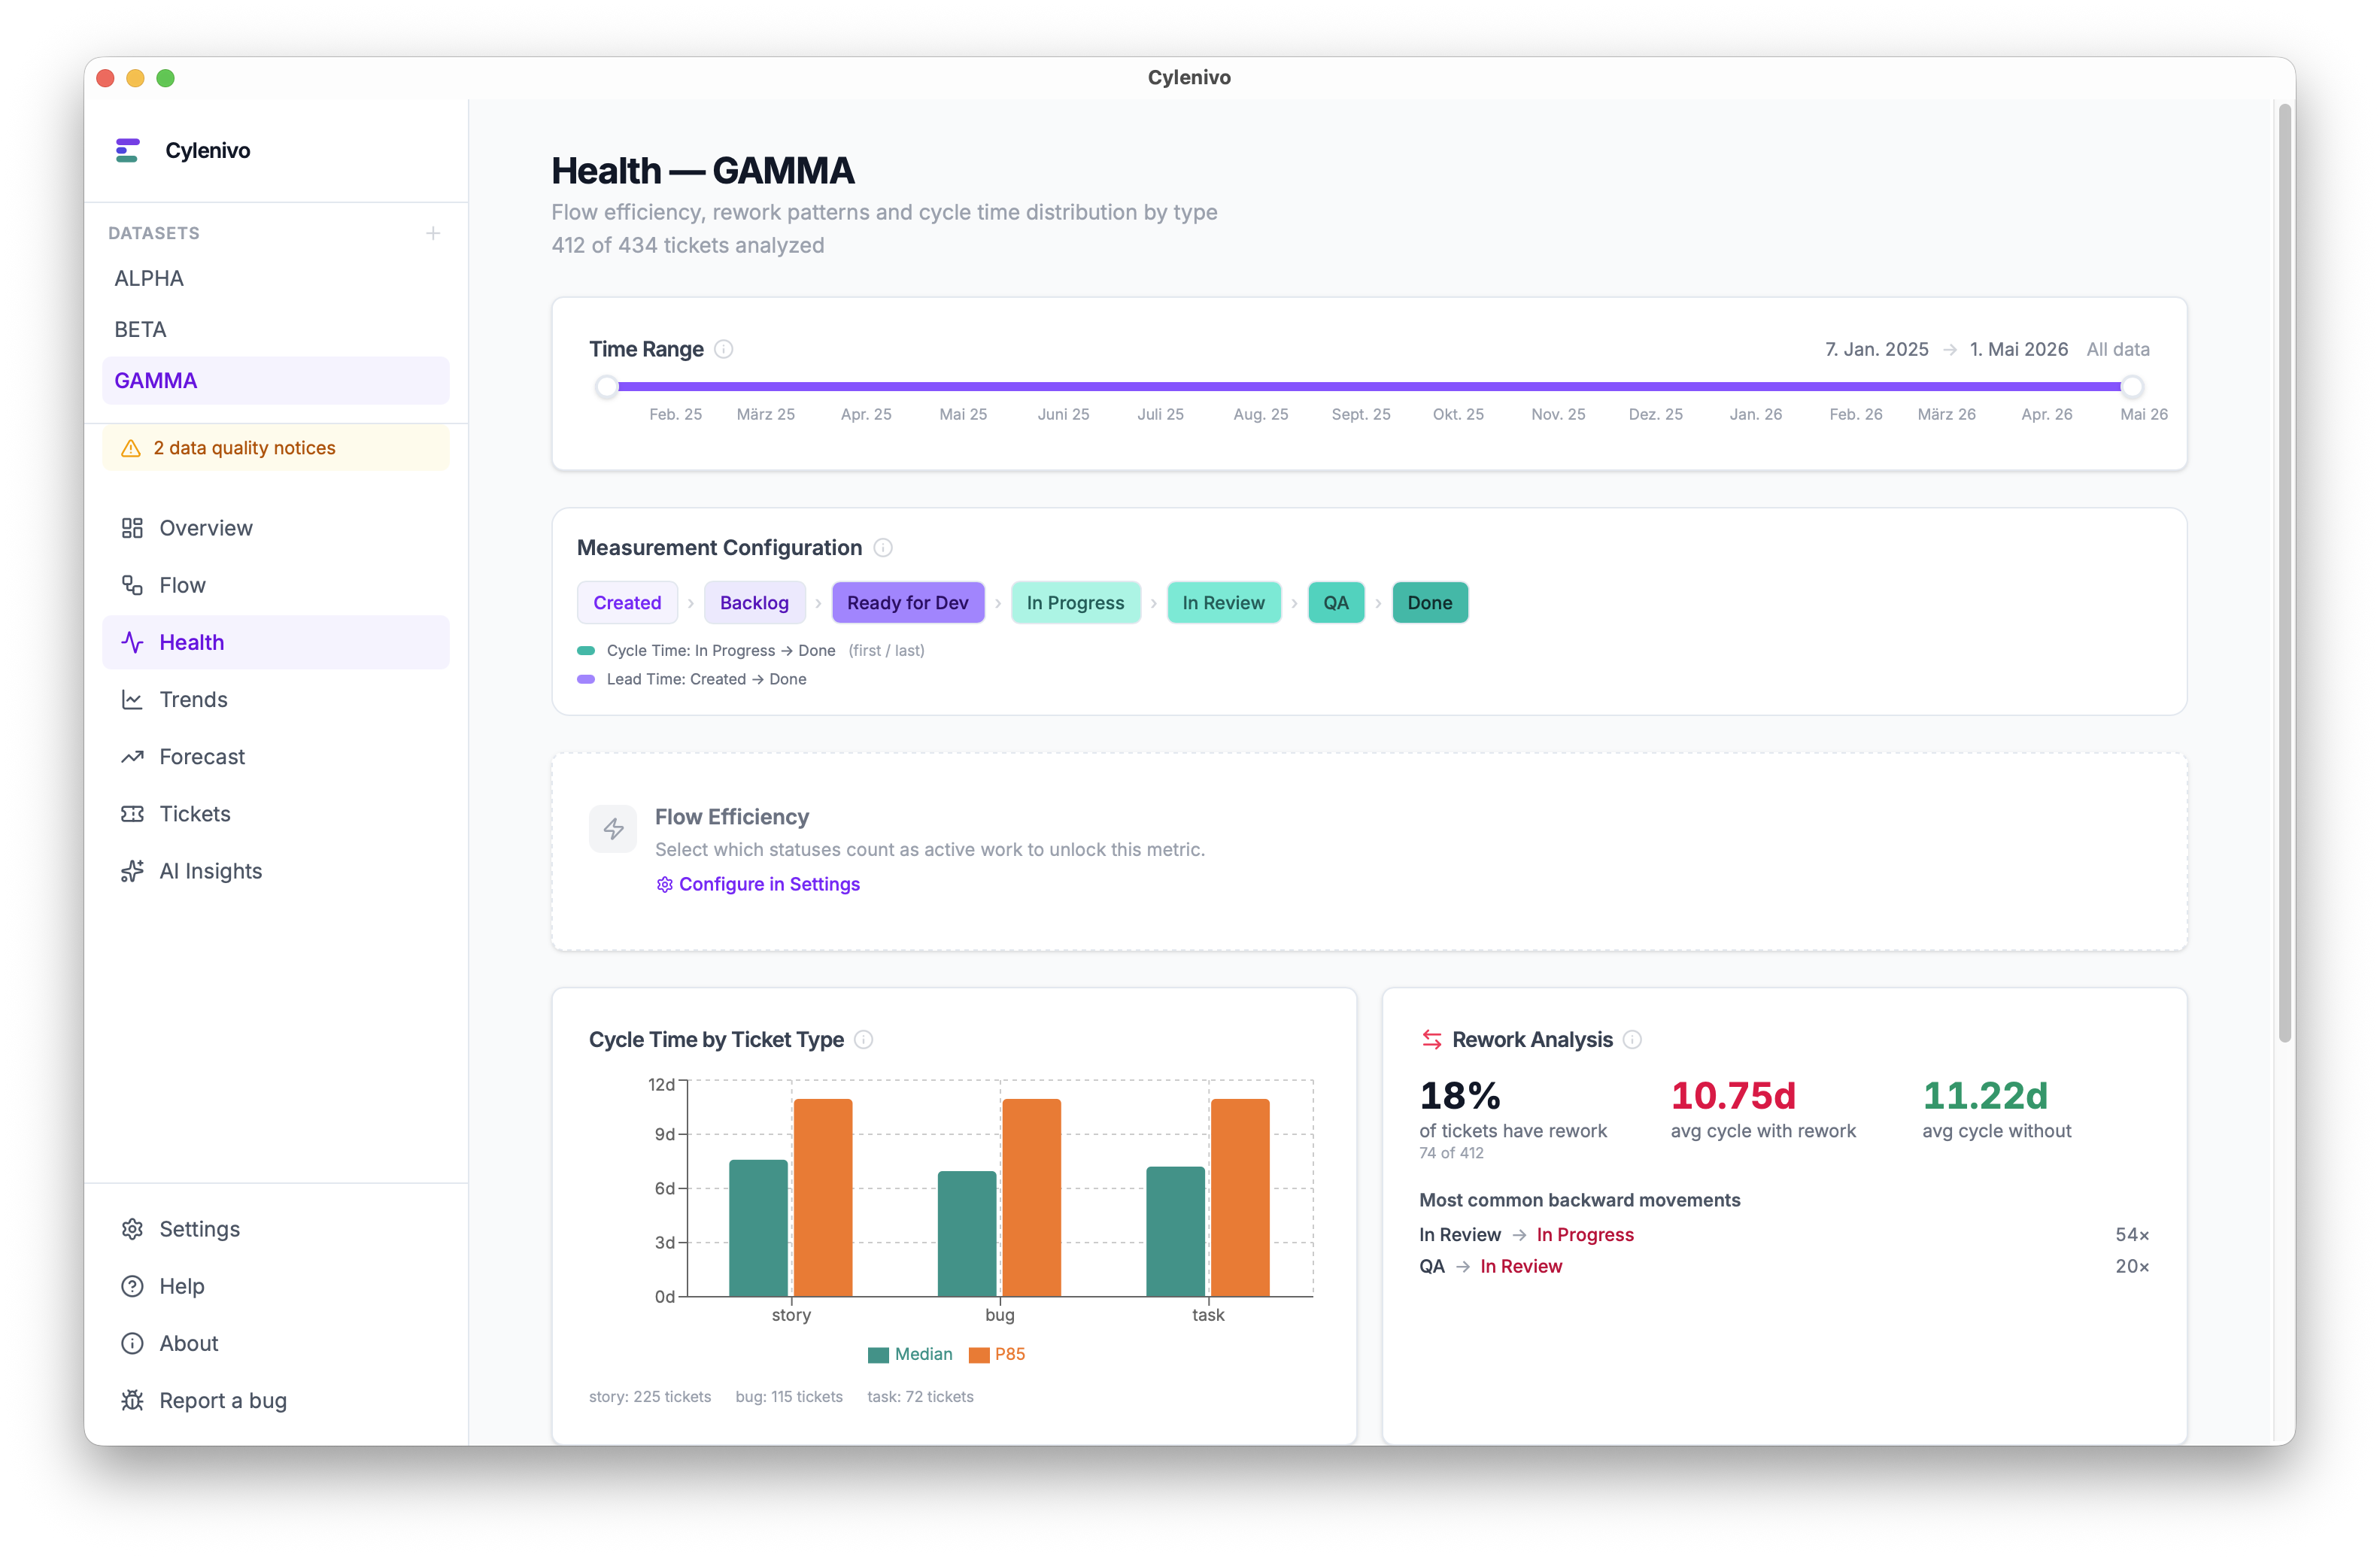
Because I wanted to know how long tickets actually sit around in our team. Not "what is done_date – start_date", but where the time really leaks away. In which status. How often tickets move backwards ("rework"). Which workflow step is the hidden bottleneck.
You can't answer those questions cleanly in any PM tool, because most tools work off ticket fields. Cylenivo works off status transitions and uses every single from_status → to_status step with a timestamp. That's the difference between "the ticket was open for 12 days" and "the ticket was in Review for 4 days, then back in Dev for 6 days, then in Review again for 2 days". The second story is the interesting one.
What you do with it in the team
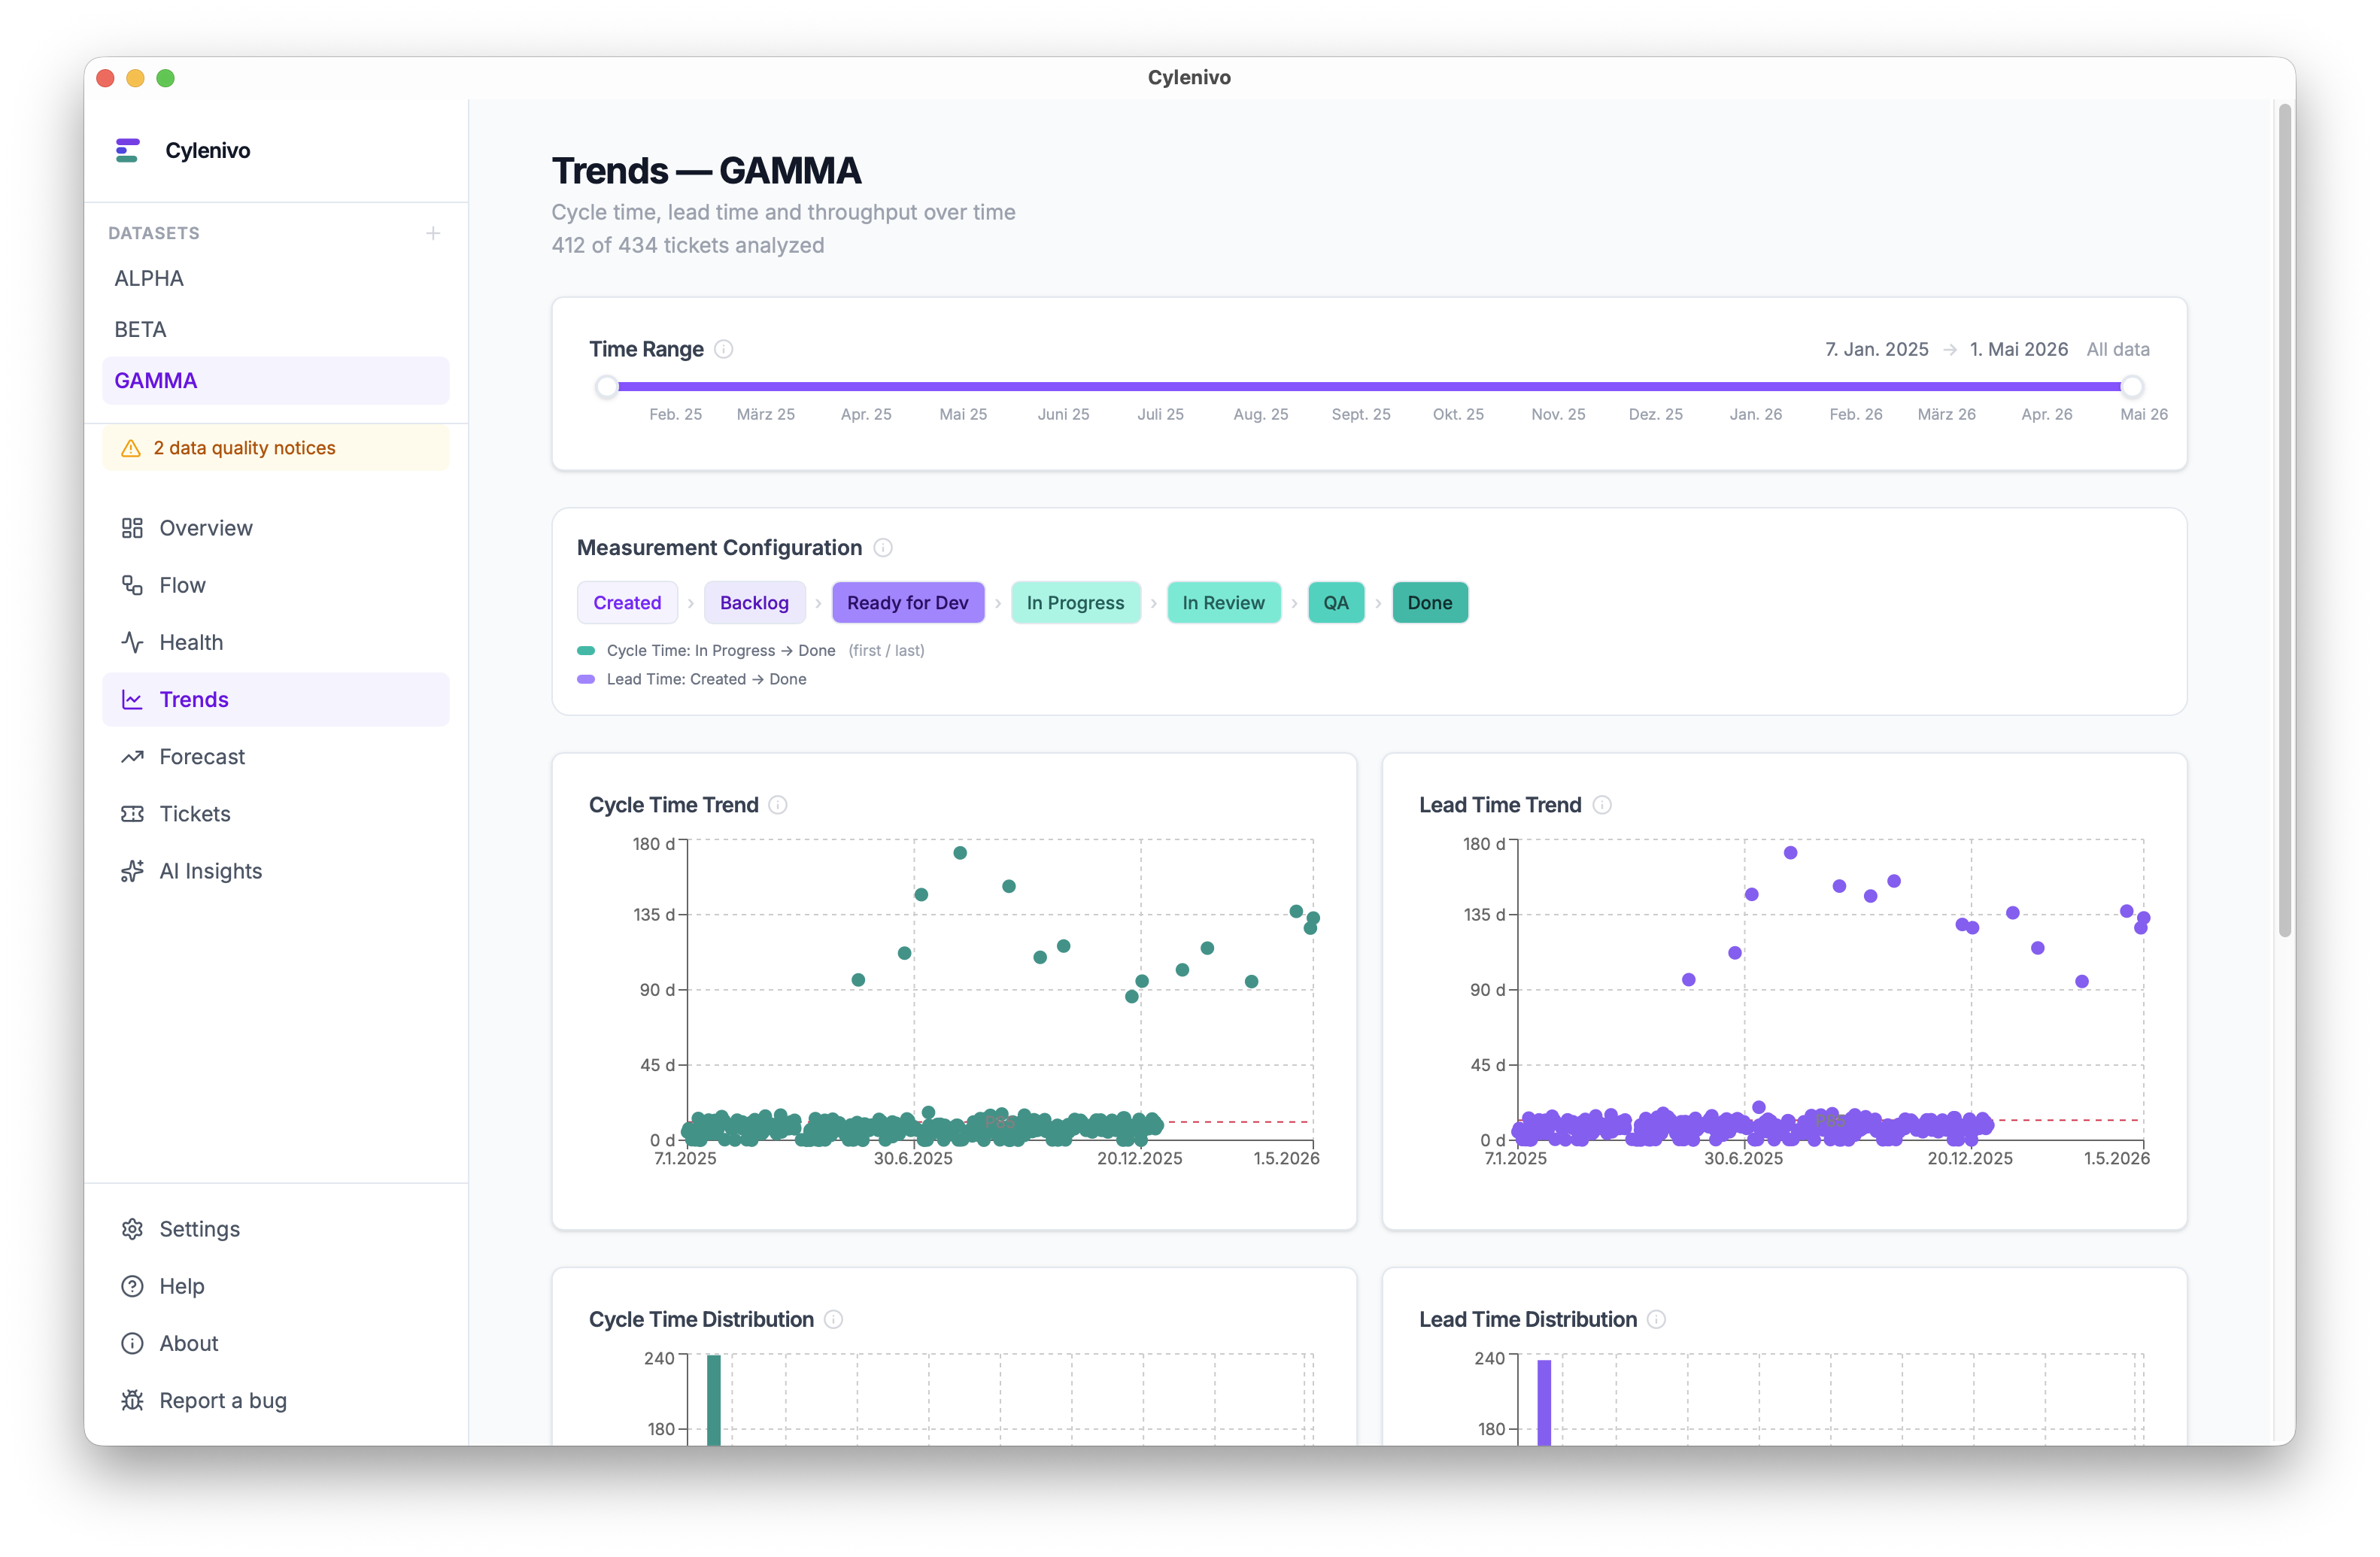
You look at the cycle time distribution together. P50, P85, P95. The question is not "who is slow". The question is "what do we learn from this".
If the P85 is twice as high as the P50, you have an outlier problem: something is regularly throwing tickets back. Look into the rework analysis. Which status path is walked backwards most often? Which tickets are affected? That's a diagnosis, not a verdict.
That's exactly what makes Cylenivo a tool for the Work–Feedback Loop: you shorten the loop between "we work" and "we see what our work produces". Visibility into real lead times and rework gives the team something it can use to adjust its own process. Without someone from outside showing up and defining "measures".
What it is not
Cylenivo is not a velocity dashboard for management. Cylenivo has no personal metrics and no speed leaderboards. Anyone using Cylenivo to compare individual developers has missed the point of the tool, and won't get anything useful out of the data anyway.
What it can do: Monte Carlo forecasts. If someone asks you when the next 30 tickets will be done, you simulate it once from the last few weeks of throughput and give back an honest range. No made-up deadline, no story point magic.
Where the data stays
On your machine: we use a SQLite file in the app directory. If you want to use the AI analysis, you can plug in Ollama locally or configure an external provider of your choice. But no one is forcing you to dump engineering data into a cloud whose business model you don't know. That matters enough to me that it was a design decision, not a feature bullet.
If you want to try it
Cylenivo is open source (MIT + Commons Clause), runs on macOS, Linux and Windows, and has a plugin system for data sources beyond Jira. The app lives at cylenivo.org, the code is at github.com/nobsagile/cylenivo.
If you have a team that wants to look at its own work honestly, the app might be something for you. If you're looking for a reporting tool for the next steering meeting, there are better options.
Let me know how it goes for you – nobsagile@gmail.com or https://mastodon.social/@cylenivo on Mastodon.